Can Odoo Sales Analytics Dashboard Improve Decisions?
Modern businesses generate large volumes of sales data every day. Orders, quotations, customer interactions, product performance, and revenue figures all contribute to valuable business insights. However, collecting data alone is not enough. Decision-makers need a way to organize, visualize, and interpret this information quickly. This is where an Odoo sales analytics dashboard becomes an essential business tool.
An effective dashboard transforms raw sales data into meaningful visual reports, allowing managers to identify trends, monitor key performance indicators (KPIs), and make informed business decisions. Alongside other Odoo dashboards, it provides a centralized view of business performance that supports strategic planning and operational efficiency.
What Is an Odoo Sales Analytics Dashboard?
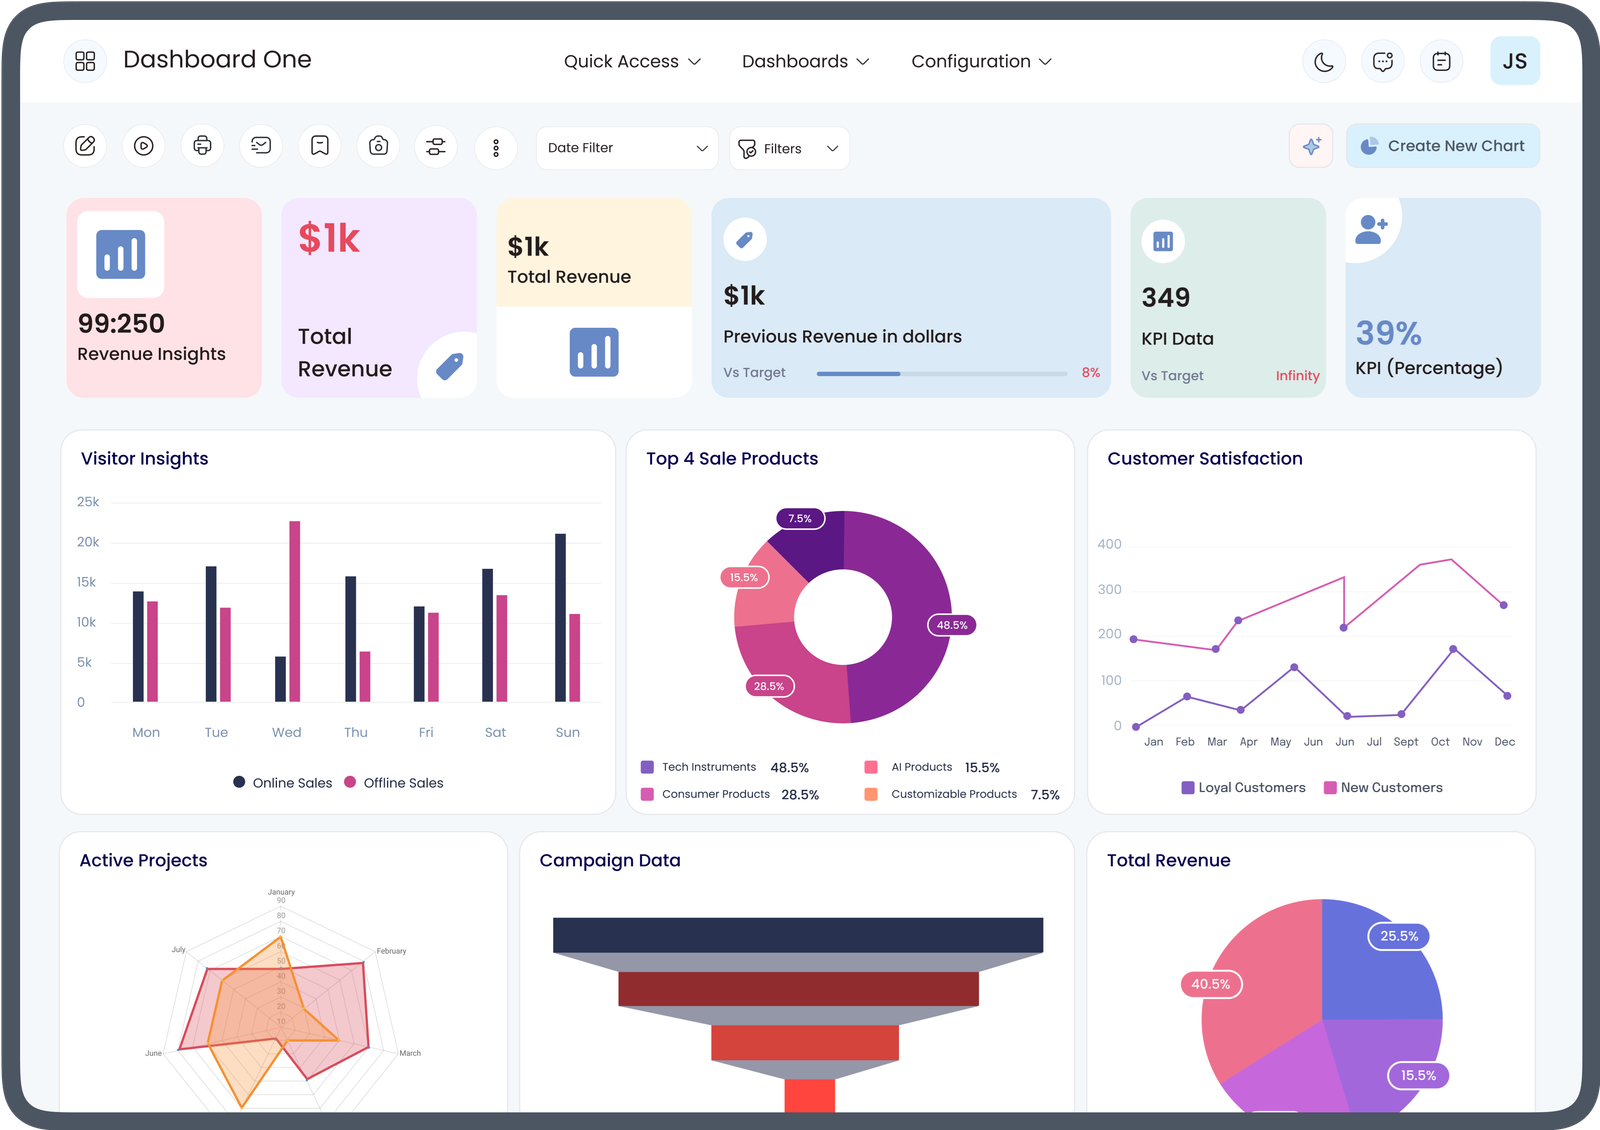
An Odoo sales analytics dashboard is a visual reporting interface within the Odoo ERP system that displays sales-related information in real time. Instead of reviewing multiple spreadsheets or reports, users can view important sales metrics through charts, graphs, tables, and KPI cards from a single screen.
The dashboard typically includes information such as:
- Total sales revenue
- Sales by product
- Sales by customer
- Monthly sales trends
- Sales team performance
- Quotations versus confirmed orders
- Order status
- Revenue by region
By presenting information visually, businesses can understand their sales performance more efficiently and make faster decisions.
Understanding Odoo Dashboards
Odoo dashboards are customizable reporting interfaces that allow businesses to monitor different areas of their operations. Depending on the department, dashboards can display financial information, inventory data, customer service metrics, manufacturing performance, purchasing activities, human resources reports, and sales analytics.
Instead of switching between multiple modules, users can access the most relevant information through personalized dashboards designed for their specific roles.
Common dashboard types include:
- Sales dashboards
- CRM dashboards
- Accounting dashboards
- Inventory dashboards
- Manufacturing dashboards
- Purchasing dashboards
- HR dashboards
- Executive dashboards
Each dashboard helps users focus on the information that matters most to their daily responsibilities.
Why Better Data Leads to Better Decisions
Business decisions become more effective when they are based on accurate and timely information rather than assumptions.
Without a centralized reporting system, organizations may experience:
- Delayed reporting
- Inconsistent information
- Duplicate data
- Manual spreadsheet errors
- Slow decision-making
- Limited visibility into sales performance
A centralized dashboard solves these challenges by providing real-time access to business information.
Real-Time Sales Visibility
One of the biggest advantages of an Odoo sales analytics dashboard is its ability to display current sales performance.
Managers no longer need to wait for weekly or monthly reports. Instead, they can immediately monitor:
- New orders
- Confirmed sales
- Pending quotations
- Revenue growth
- Customer activity
- Sales trends
Real-time visibility allows businesses to respond quickly when performance changes.
Monitoring Sales Team Performance
Sales managers need accurate information to evaluate individual and team performance.
A sales dashboard can display:
- Revenue generated by each salesperson
- Number of quotations created
- Conversion rates
- Average order value
- Closed opportunities
- Sales targets achieved
These insights help managers identify training opportunities, recognize high performers, and improve overall sales productivity.
Identifying Sales Trends
Every business experiences changing customer demand throughout the year.
An Odoo sales analytics dashboard helps businesses recognize patterns such as:
- Seasonal demand
- Product popularity
- Customer purchasing behavior
- Sales growth over time
- Declining product performance
Recognizing these trends enables organizations to adjust pricing, inventory, and marketing strategies before challenges become larger problems.
Improving Forecasting Accuracy
Forecasting future sales is easier when historical data is organized and accessible.
Dashboards provide valuable information that supports forecasting by showing:
- Historical sales performance
- Current sales pipeline
- Expected revenue
- Pending quotations
- Customer buying trends
Accurate forecasting helps businesses allocate resources more effectively and prepare for future demand.
Supporting Faster Executive Decisions
Executives often need quick answers without reviewing lengthy reports.
Instead of requesting multiple spreadsheets from different departments, leadership teams can review visual dashboards that summarize key business information.
This enables faster decisions regarding:
- Budget planning
- Sales strategy
- Resource allocation
- Product investments
- Regional expansion
- Business priorities
Quick access to reliable information supports more confident leadership decisions.
Customizable Reporting for Different Departments
One major advantage of Odoo dashboards is flexibility.
Different departments require different information.
For example:
Sales Department
- Revenue
- Sales targets
- Customer orders
- Product performance
Finance Department
- Outstanding invoices
- Cash flow
- Payment status
- Profitability
Inventory Team
- Stock availability
- Inventory valuation
- Product movement
- Reorder levels
Executive Management
- Company-wide KPIs
- Revenue growth
- Department performance
- Overall business health
Each department can create dashboards that match its operational goals.
Better Customer Insights
Understanding customer behavior plays an important role in business growth.
Dashboards can provide information such as:
- Top customers
- Repeat purchase rates
- Customer lifetime value
- Frequently purchased products
- Geographic sales distribution
These insights help businesses develop stronger customer relationships and improve service quality.
Improved Collaboration Across Teams
Centralized reporting encourages collaboration between departments.
Sales, finance, inventory, and management teams can access consistent information without relying on separate reporting systems.
This improves communication by ensuring everyone works from the same data source.
As a result, businesses experience:
- Better coordination
- Fewer reporting conflicts
- Faster issue resolution
- More consistent planning
Simplifying KPI Monitoring
Key Performance Indicators (KPIs) help businesses measure success.
An Odoo sales analytics dashboard makes KPI tracking easier by displaying important metrics in one location.
Examples include:
- Monthly sales revenue
- Sales growth
- Customer acquisition
- Average order value
- Conversion rate
- Sales target achievement
- Product performance
Regular KPI monitoring helps organizations identify opportunities for continuous improvement.
Reducing Manual Reporting
Traditional reporting often requires employees to gather information from multiple systems before preparing spreadsheets.
Automated dashboards reduce this workload by:
- Collecting real-time data
- Updating reports automatically
- Eliminating repetitive manual tasks
- Reducing reporting errors
- Improving reporting consistency
Employees spend less time creating reports and more time analyzing business performance.
Enhancing Decision-Making with Data Visualization
Visual reports are often easier to understand than large tables of numbers.
Charts, graphs, gauges, and scorecards allow decision-makers to identify patterns more quickly.
Data visualization helps users:
- Compare performance
- Detect trends
- Identify exceptions
- Monitor progress
- Understand complex information
This makes business analysis faster and more effective.
Best Practices for Using Odoo Dashboards
Businesses can maximize dashboard effectiveness by following several best practices:
- Define clear business objectives.
- Track only meaningful KPIs.
- Keep dashboards simple and uncluttered.
- Update data regularly.
- Customize dashboards for different user roles.
- Review dashboards consistently.
- Train employees to interpret dashboard insights.
- Use dashboard data to support strategic planning.
Following these practices ensures dashboards remain valuable decision-making tools.
Future Benefits of Dashboard-Driven Businesses
As businesses continue adopting digital technologies, data-driven decision-making becomes increasingly important.
Organizations using Odoo dashboards gain advantages such as:
- Improved operational visibility
- Faster response to market changes
- Better resource management
- Enhanced customer understanding
- More efficient sales monitoring
- Stronger collaboration between departments
- Better strategic planning
These benefits support long-term business growth and operational excellence.
Conclusion
The answer is yes—an Odoo sales analytics dashboard can significantly improve business decisions by transforming complex sales data into clear, actionable insights. Real-time reporting, KPI monitoring, forecasting, sales performance analysis, and customer insights allow managers and executives to make informed decisions with greater confidence.
When combined with other Odoo dashboards, businesses gain a centralized platform for monitoring every aspect of their operations. Instead of relying on fragmented reports or manual spreadsheets, organizations can access accurate, real-time information that supports smarter planning, better collaboration, and continuous improvement. By using dashboards effectively, businesses can strengthen decision-making processes and build a more efficient, data-driven organization.


0 Comments